bigdata mining 4장
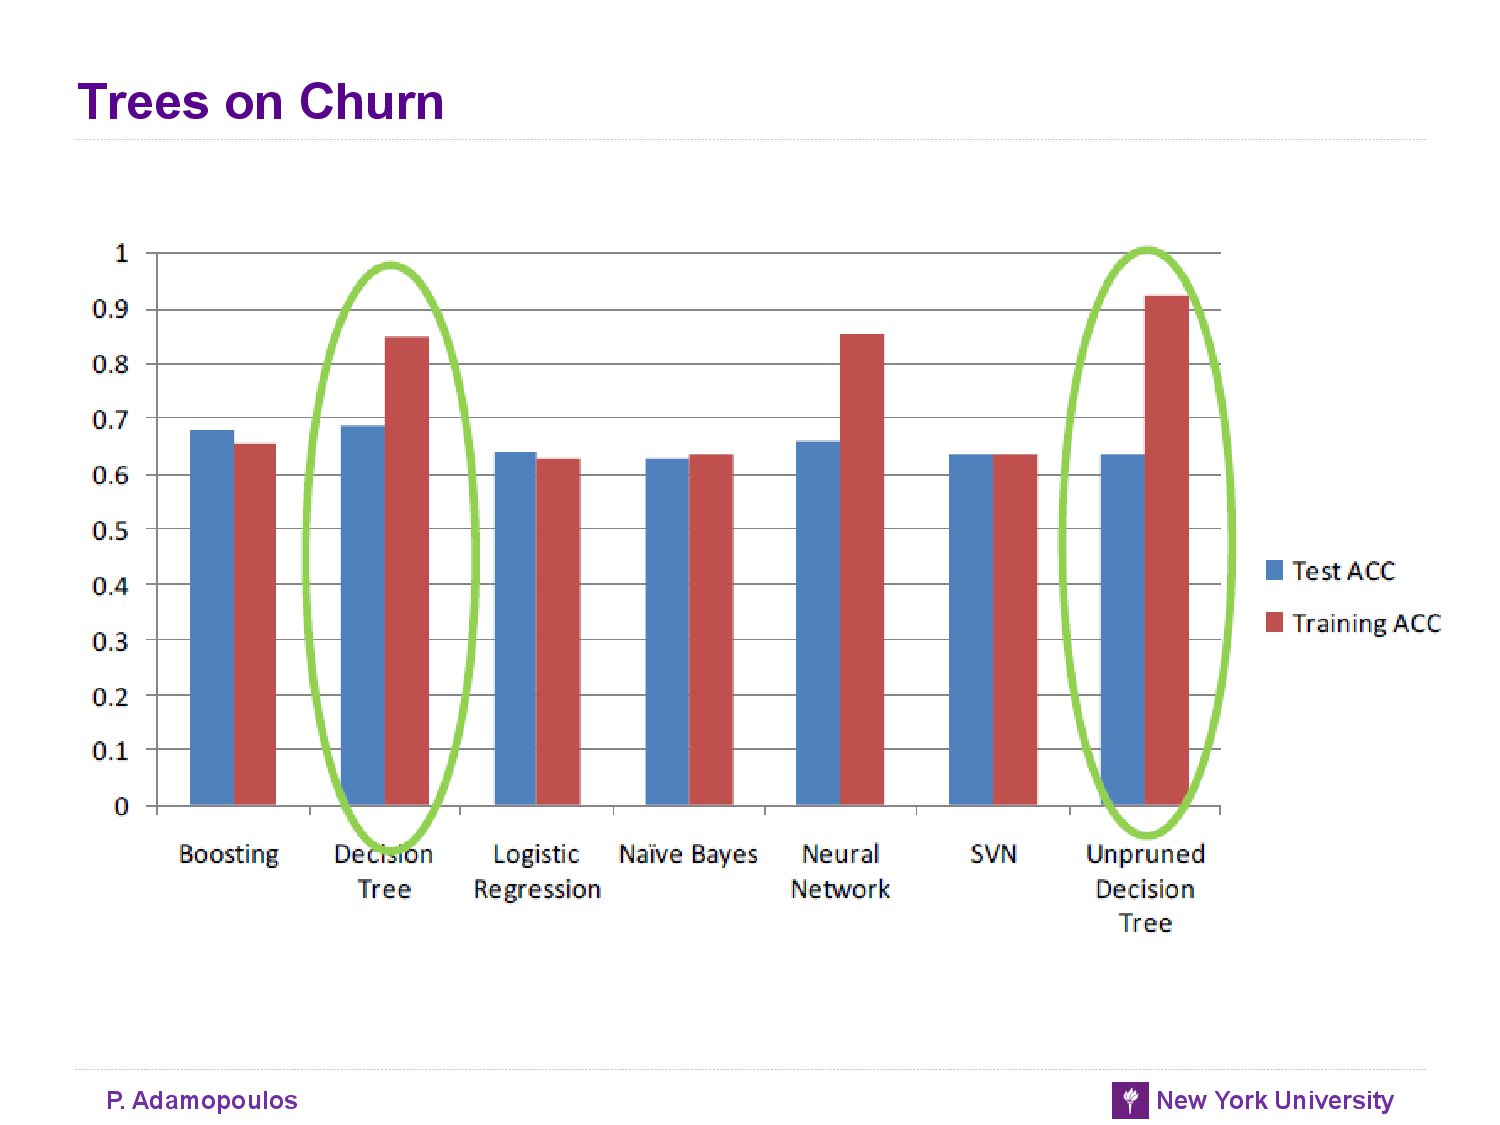
- 아래 표를 보면 unpruned decision tree가 test set에 대한 성능이 좋지 않음을 알 수 있다
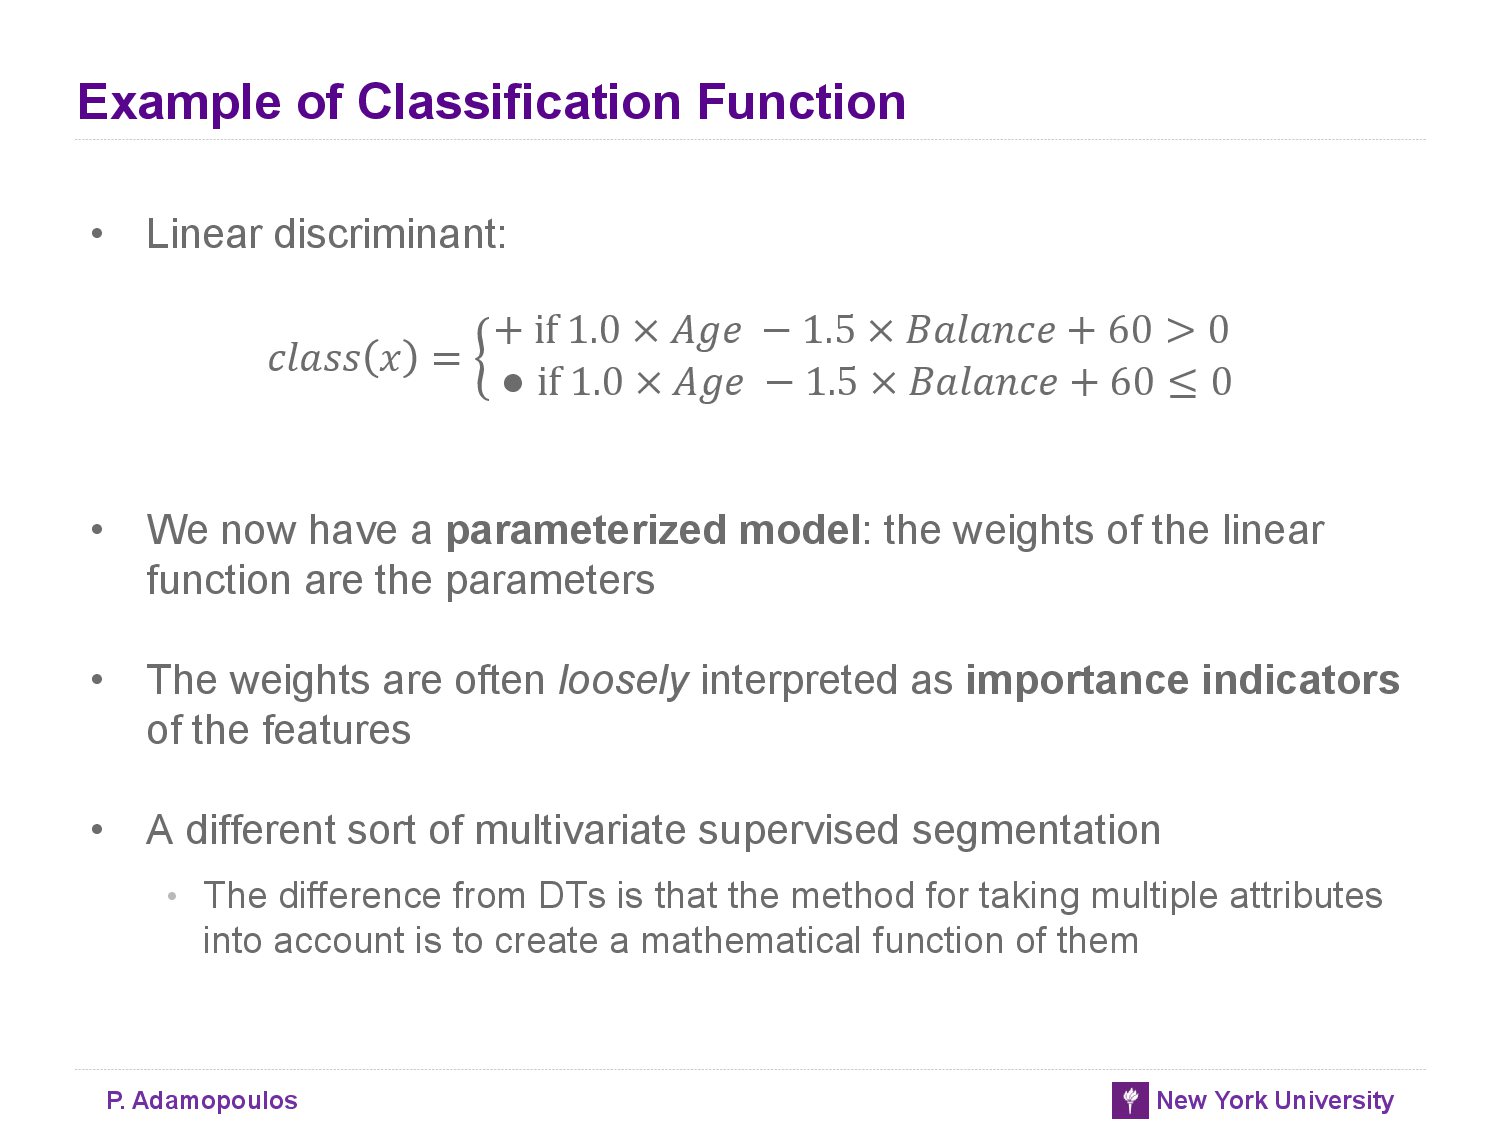
Classification via Mathmatical Fuctions
- decision boundary : partition the instance space into similar regions
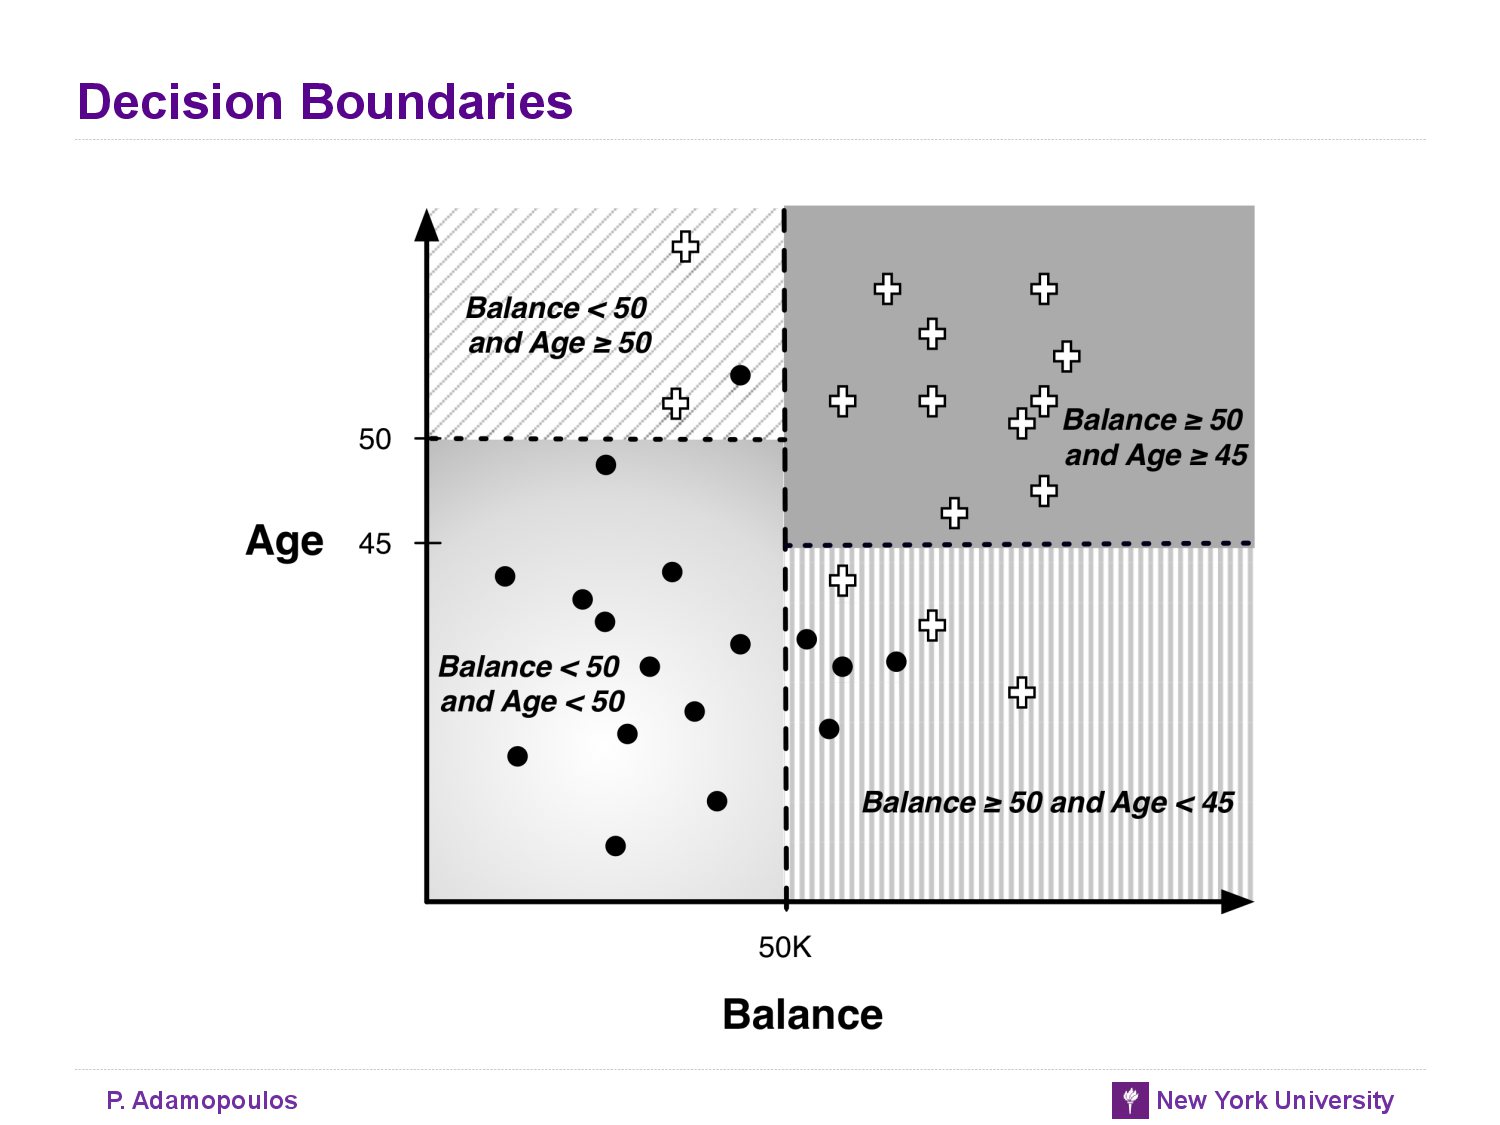
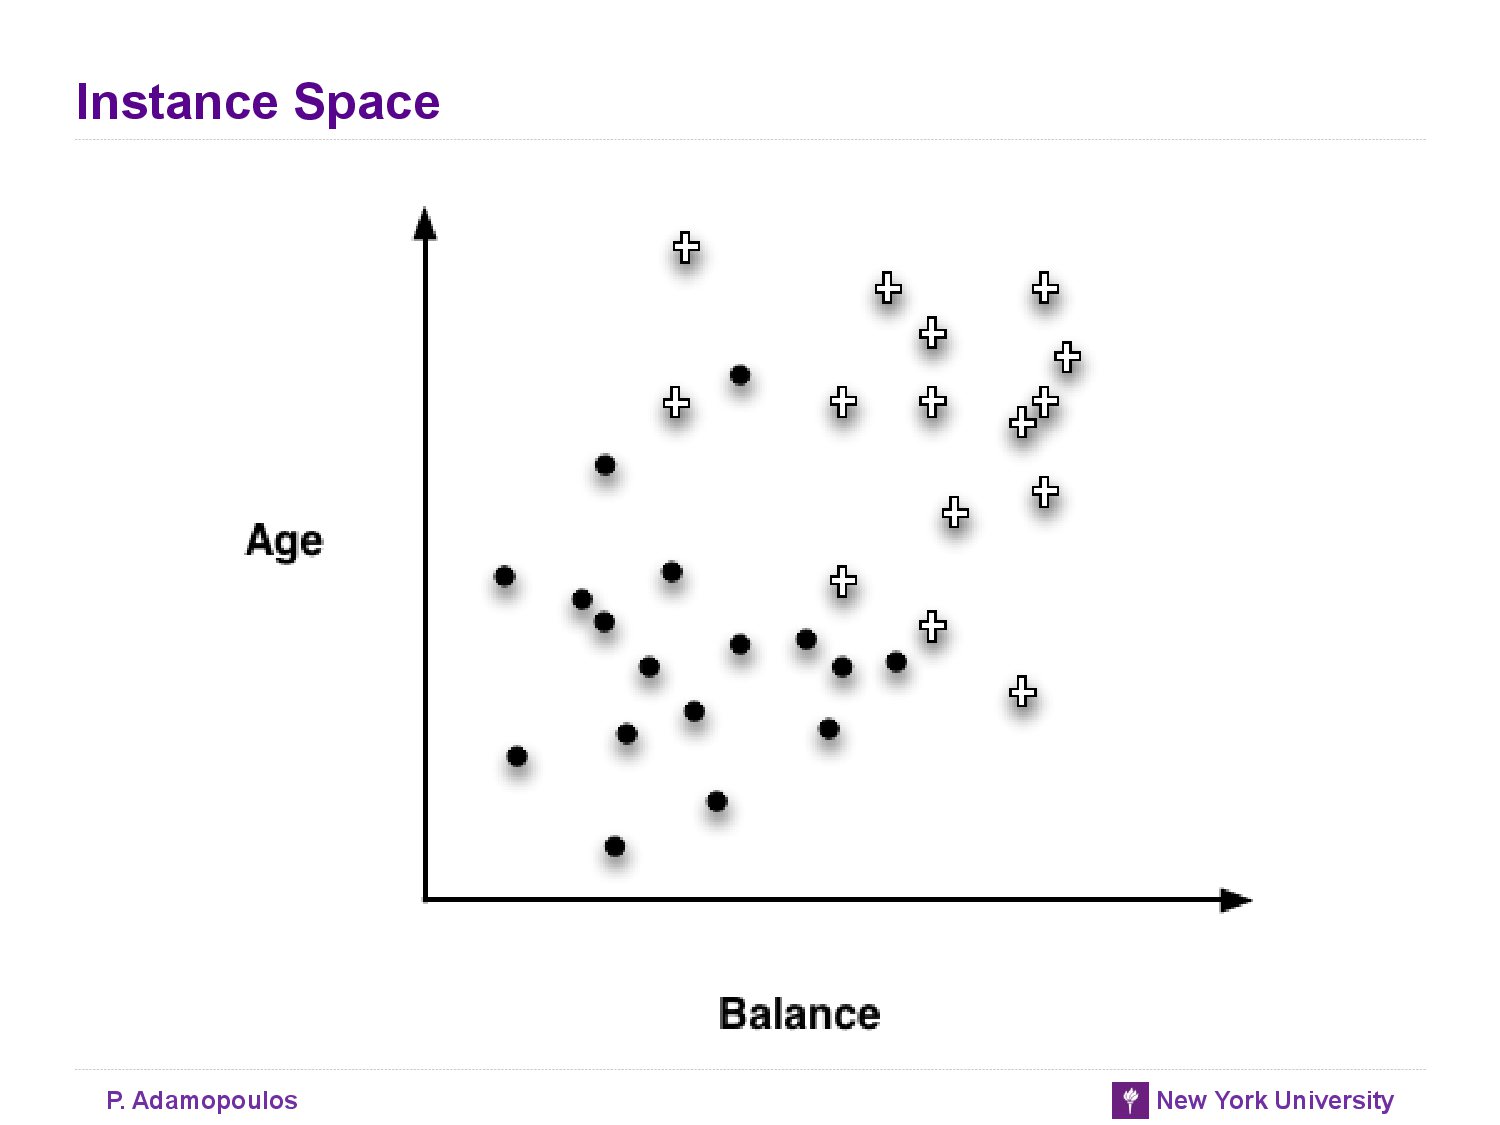
- A main purpose of creating homogeneous regions is so that we can predict the target variable of new unseen instance by determining which segment it falls into
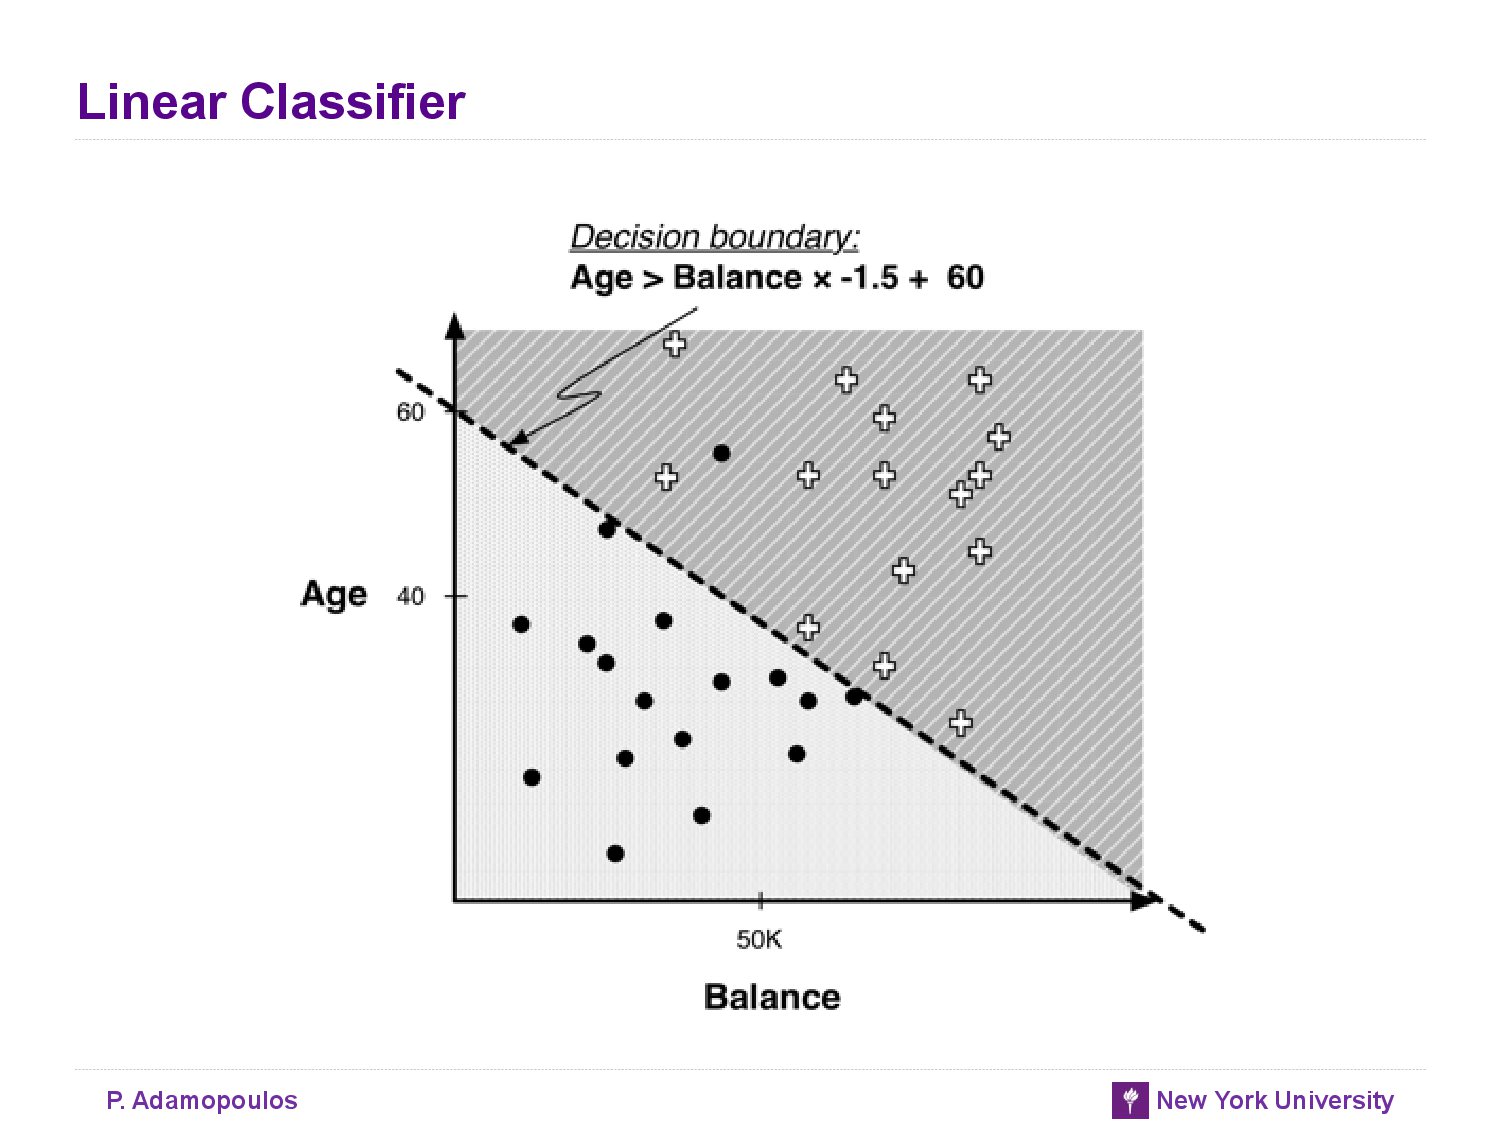
Linear Discriminant Function
-
A general linear model :
-
The larger the magnitude of a feature’s weight, the more important that feature is for classifying the target - If a feature’s weight is near zero the corresponding feature can usually be ignored or discarded
- There are infinitely many lines (models) that classify this traing set perfectly.
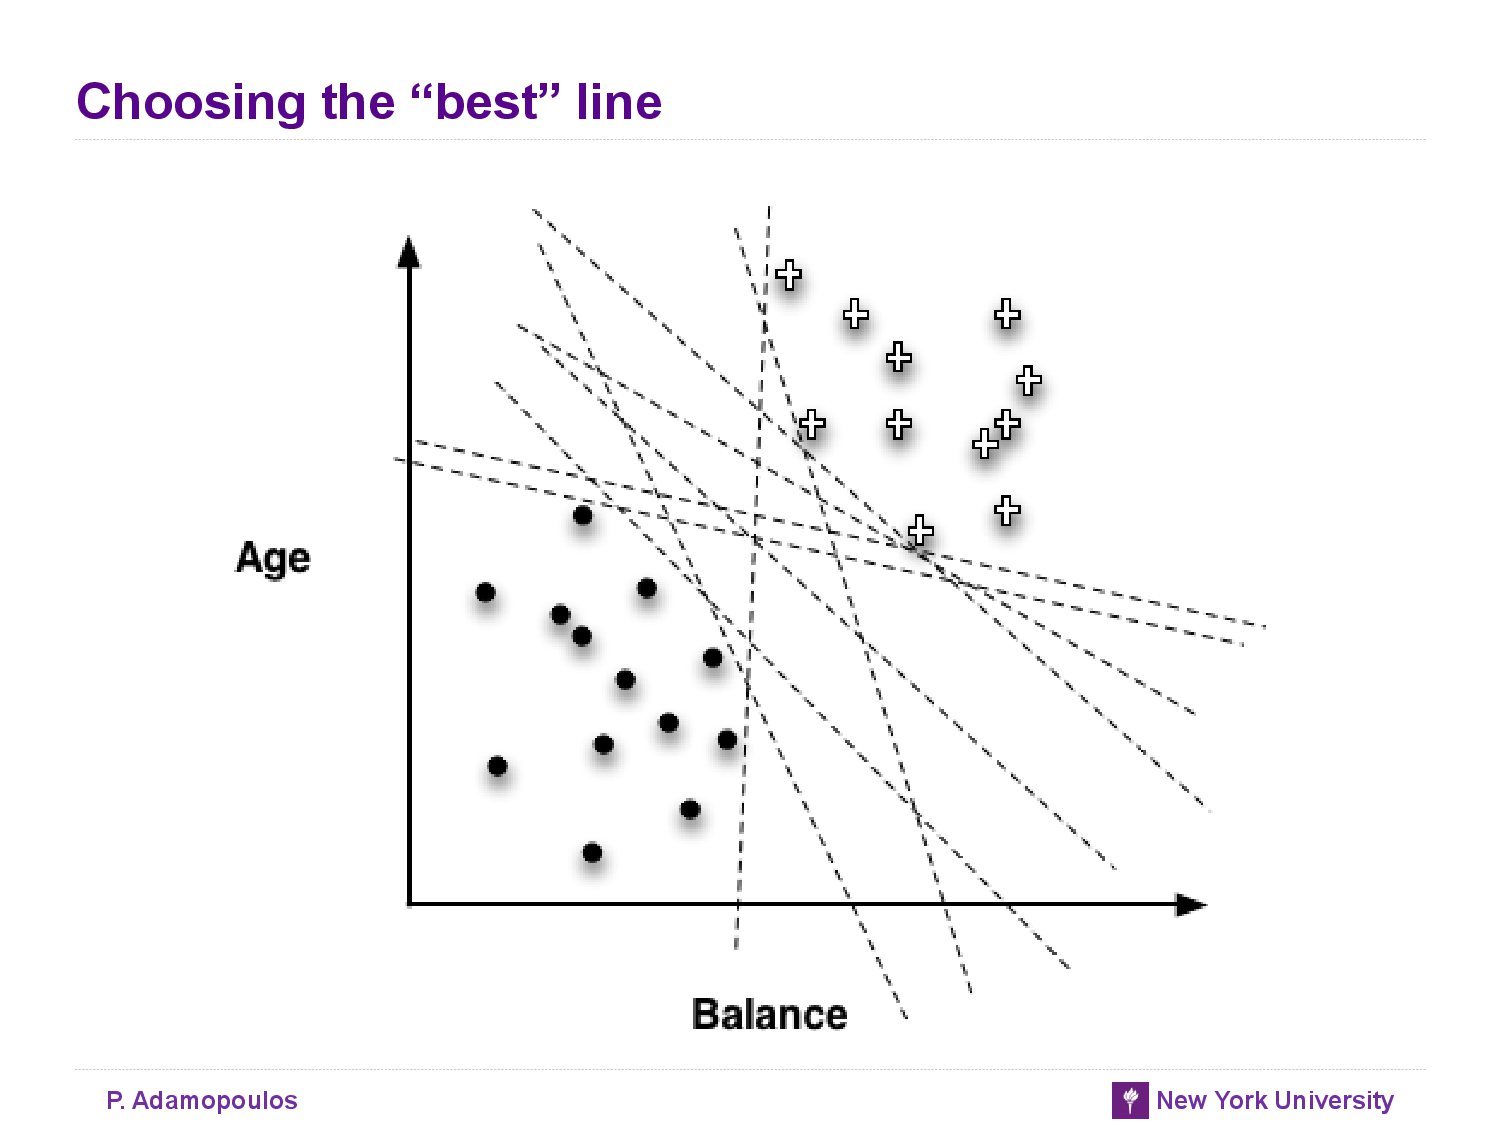
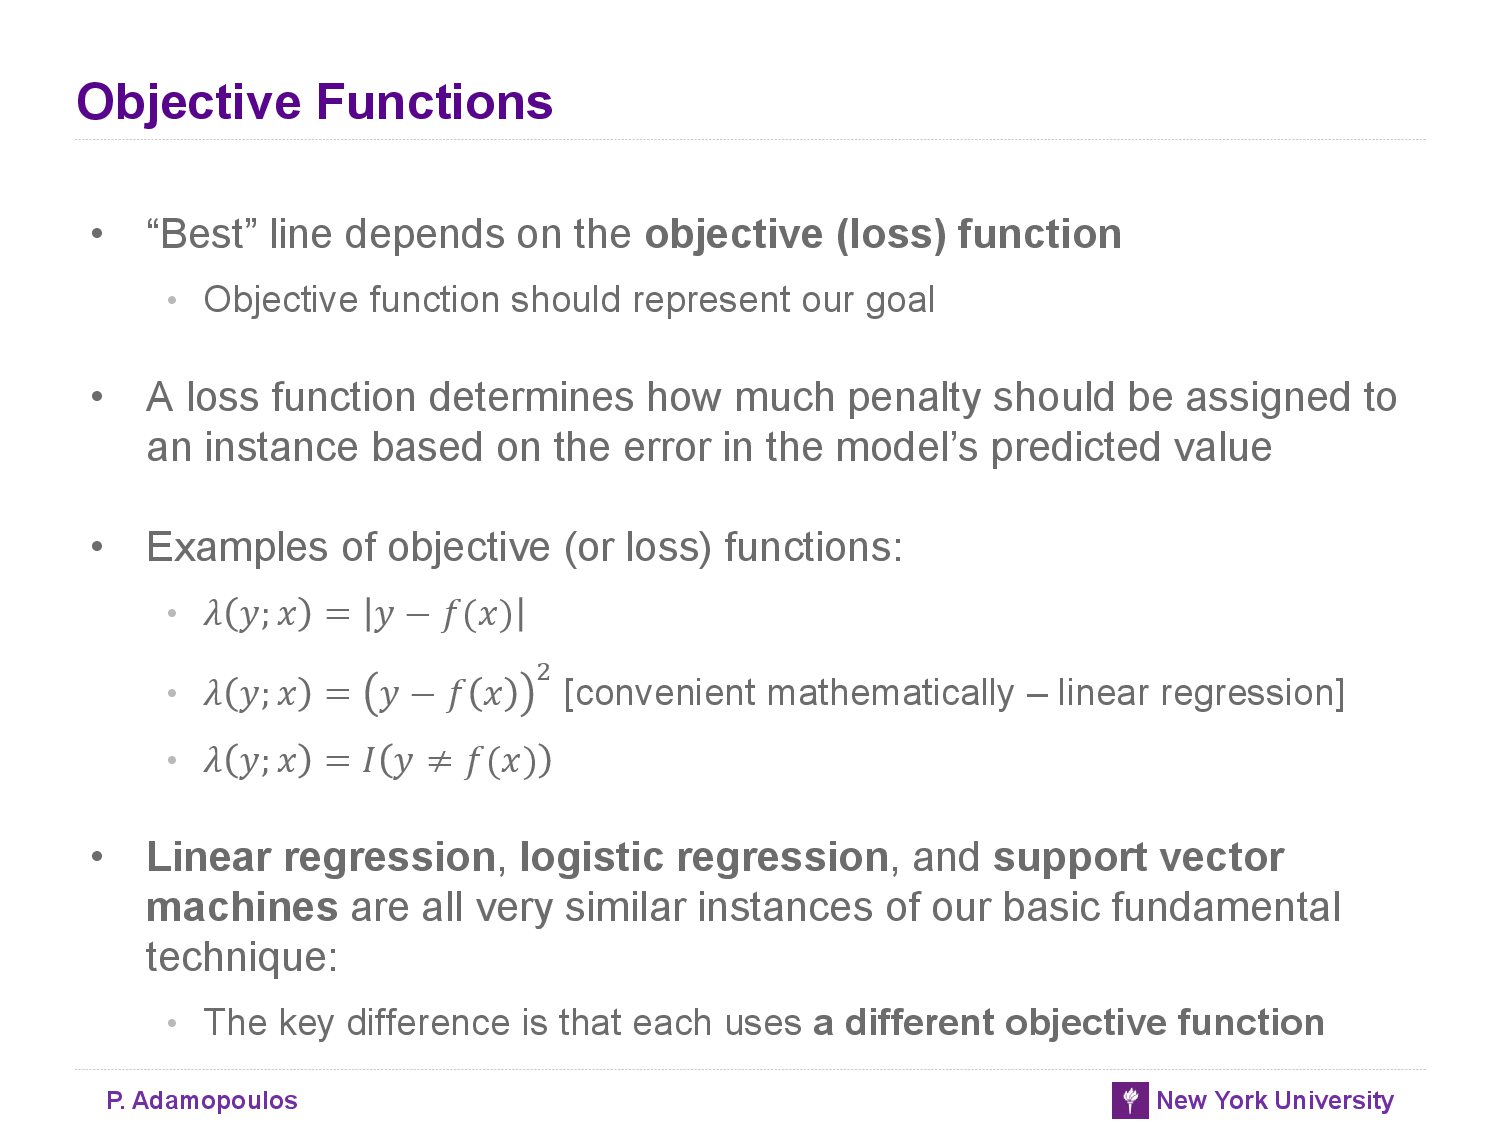
Optimazing an Objective Function
- Objective function : a function that represents our goal and can be calculated for a particualar set of weights and a particular set of data
Linear Discriminant Functions for Scoring and Ranking instances
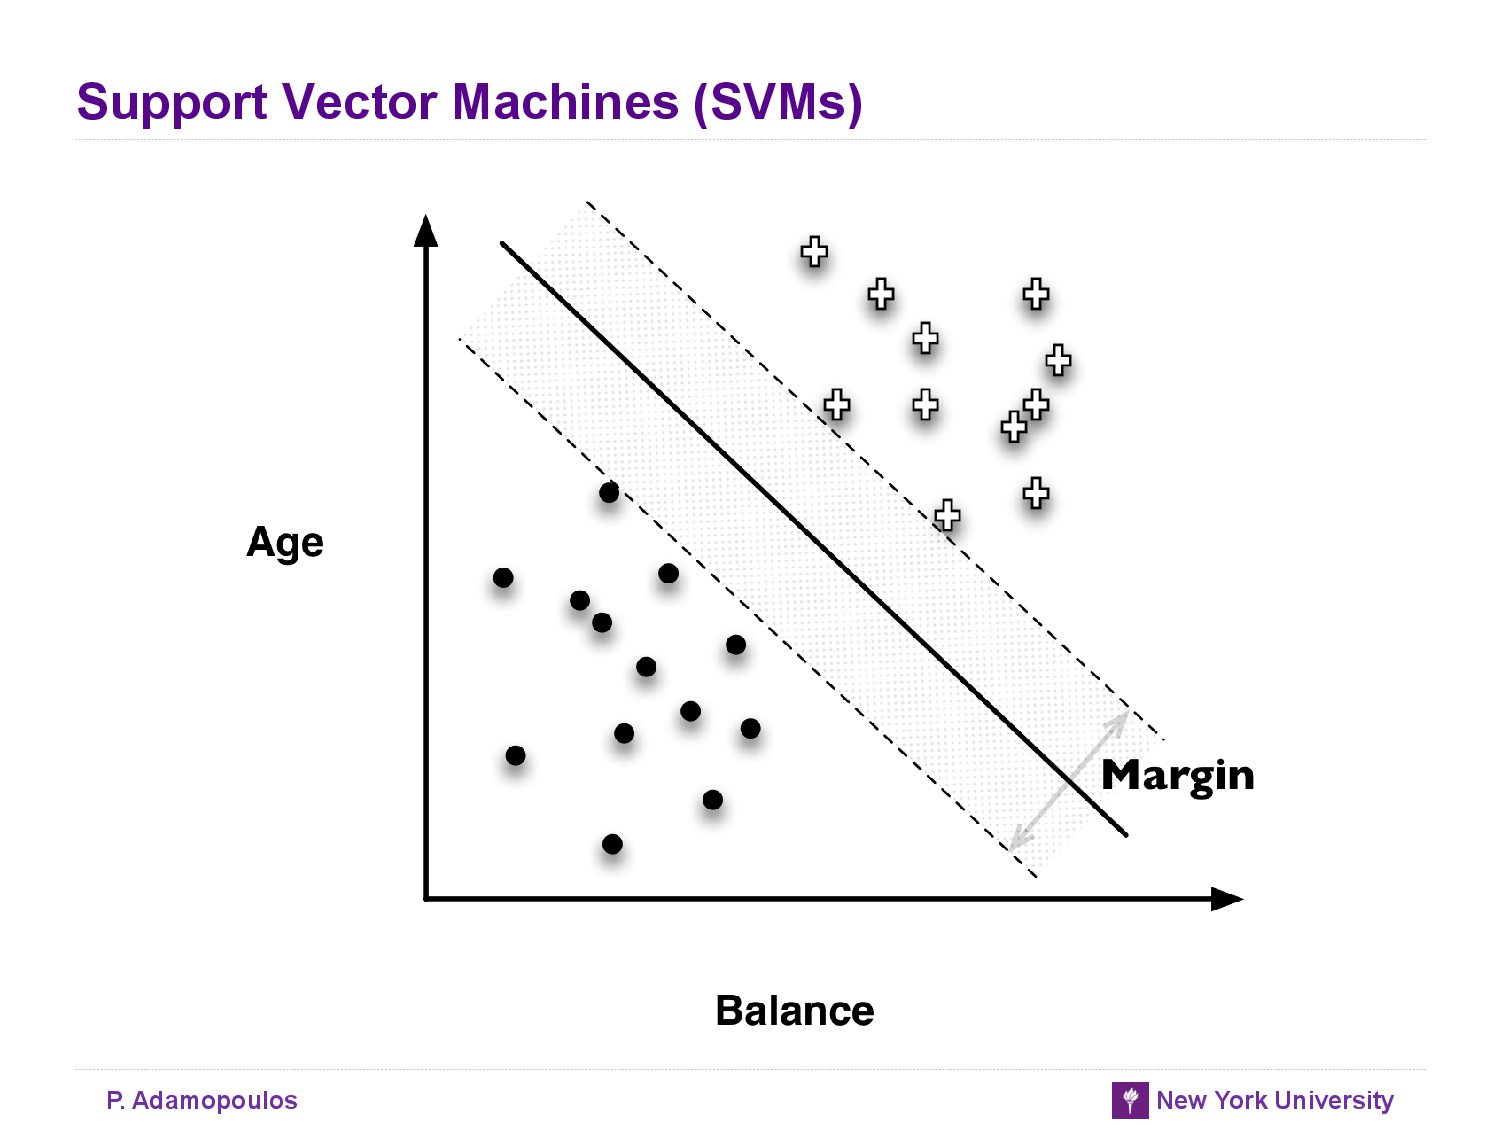
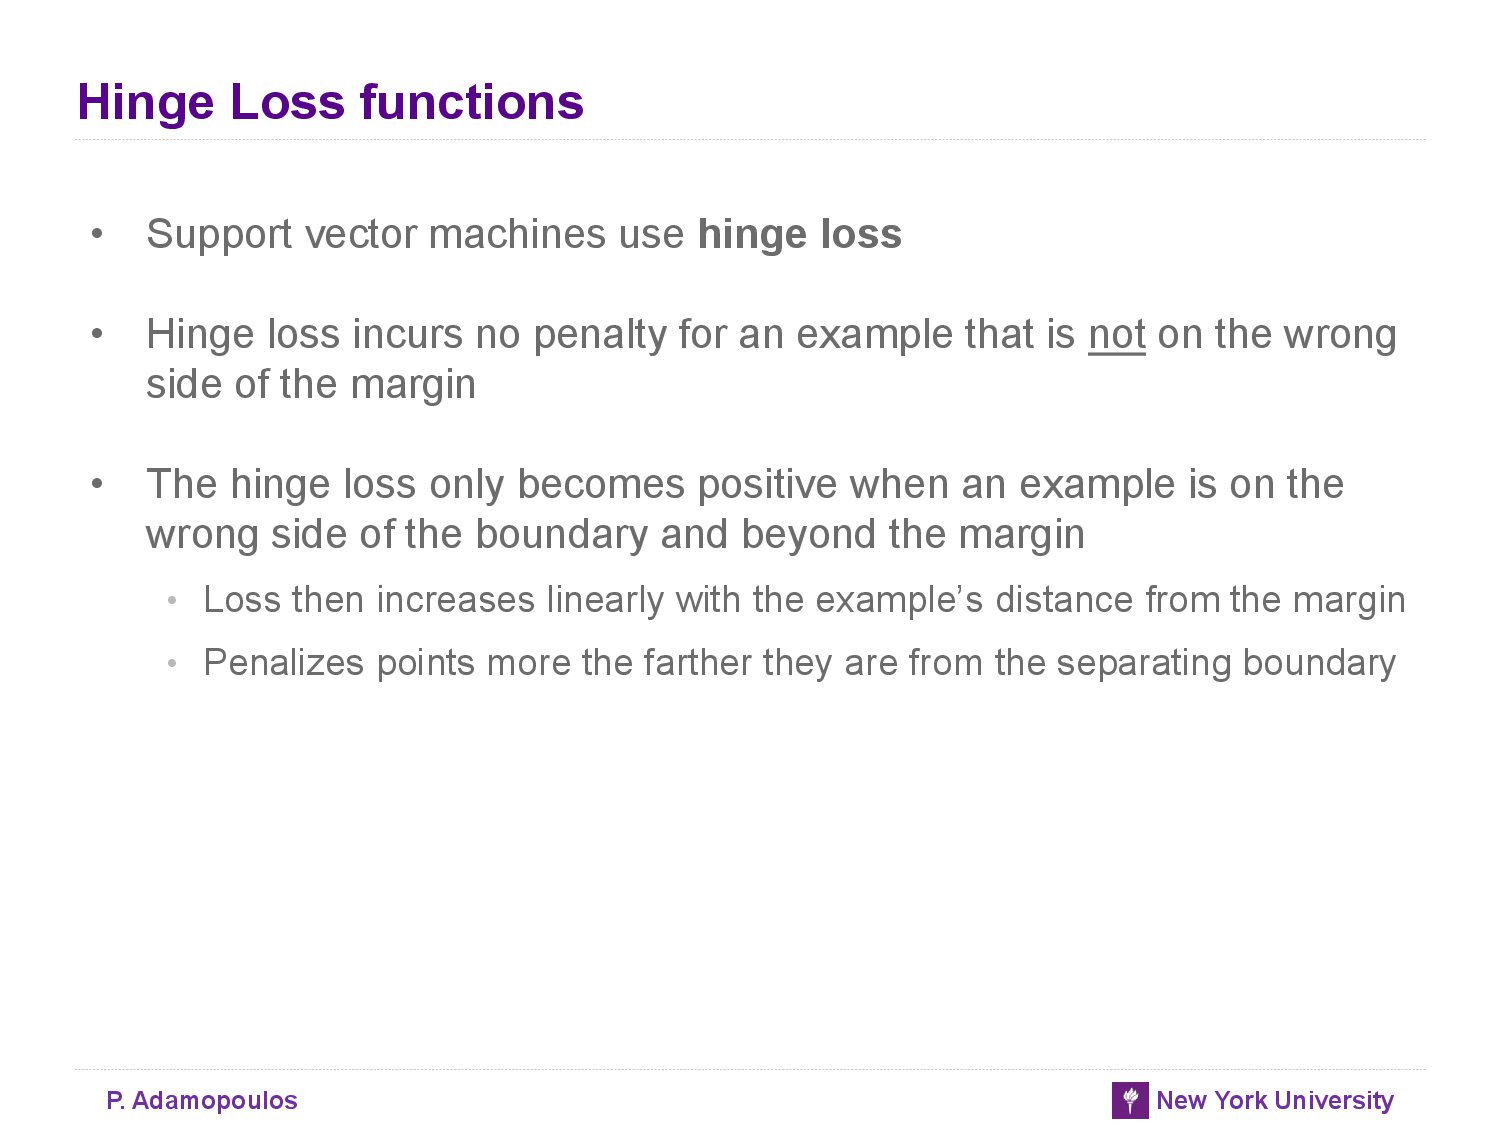
Support Vector Machine,Briefly
- SVMs choose based on a simple, elegant idea: instead of thinking about separating with a line, first fit the fattest bar between the classes.
Regression via Mathmatical Functions
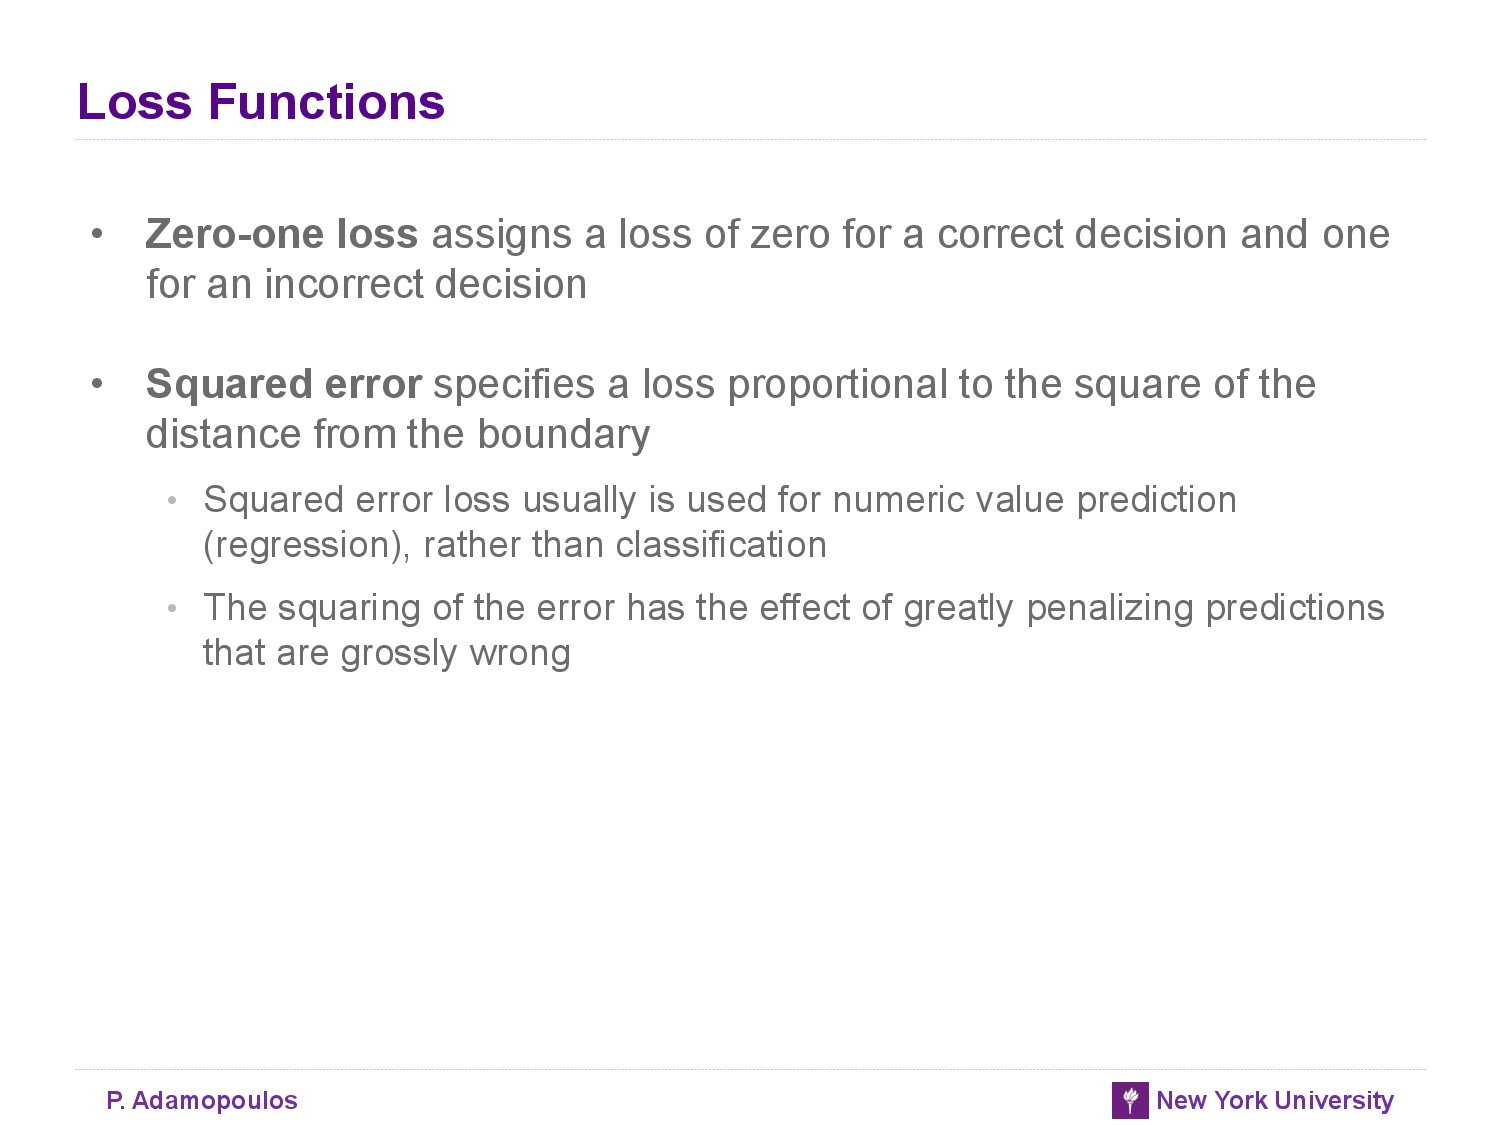
- Standard linear regression procedures instead minimize the sum or mean of the squares of these errors—which gives the procedure its common name “least squares” regression.
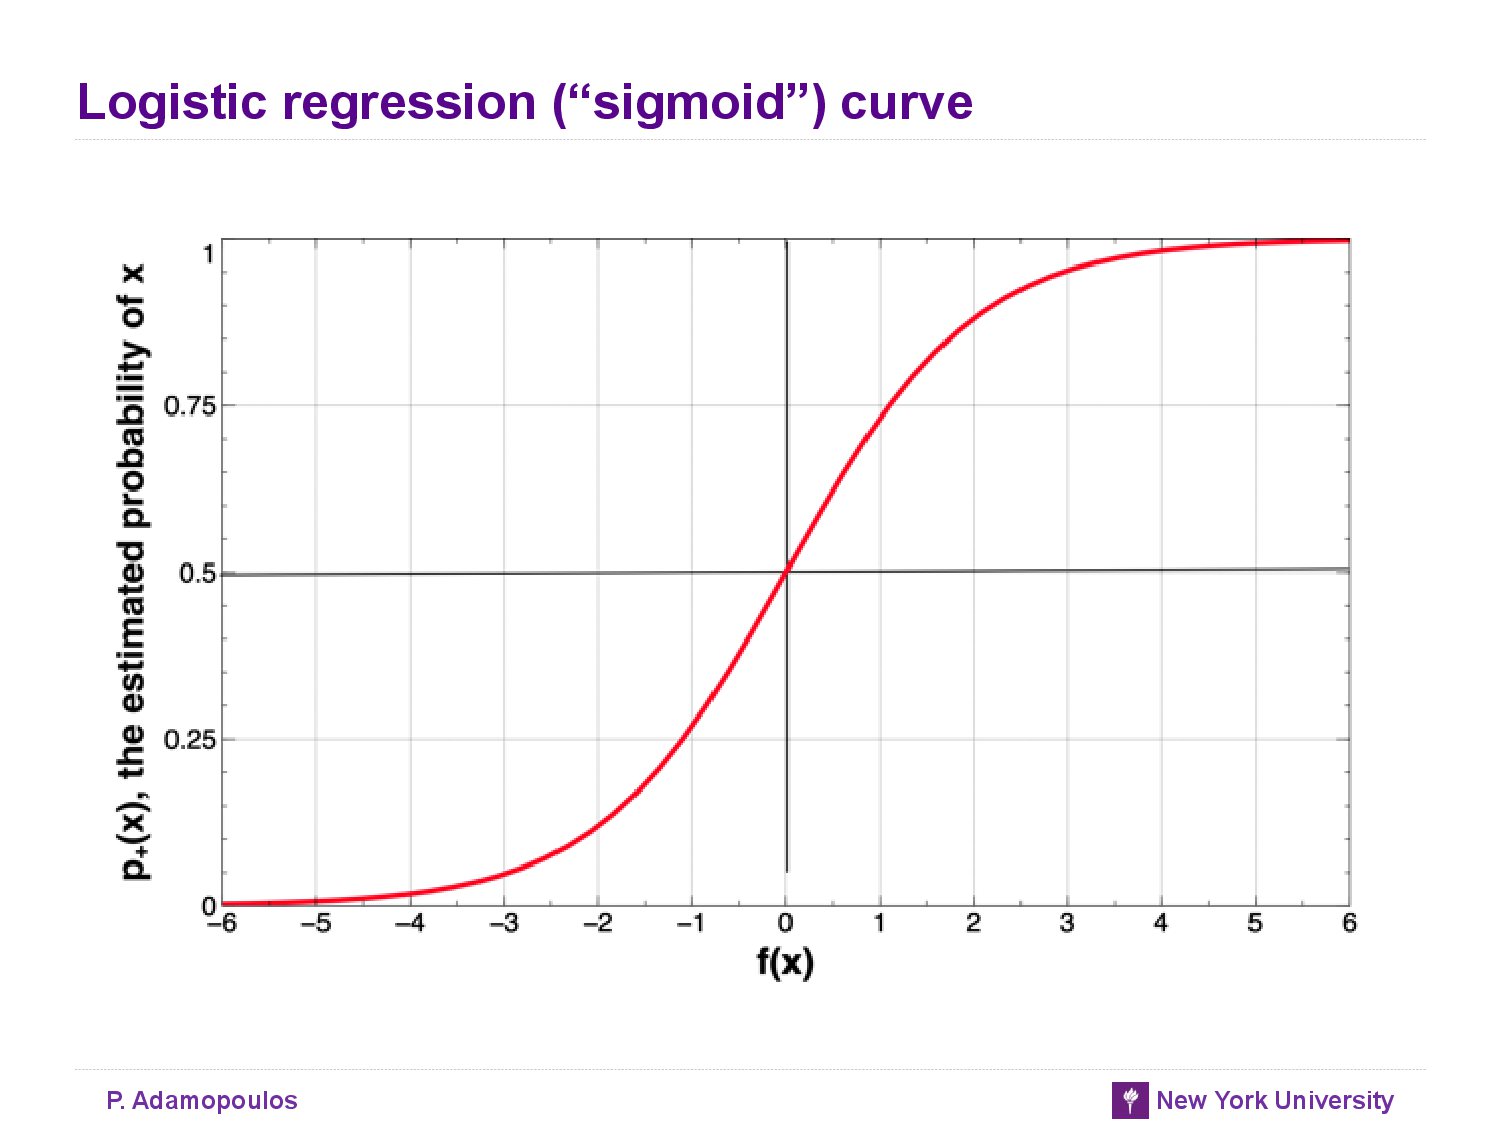
Class probability Estimation and logistic “Regression”
- for many applications we would like to estimate the probability that a new instance belongs to the class of interest.
- The odds of an eventis the ratio of the probability of the event occurring to the probability of the event not occurring.
- f(x) is the model’s estimation of the log-odds that x belongs to the positive class.
- For probability estimation, logistic regression uses the same linear model as do our linear discriminants for classification and linear regression for estimating numeric target values.
- The output of the logistic regression model is interpreted as the log-odds of class membership.
- These log-odds can be translated directly into the probability of class membership. Therefore, logistic regression often is thought of simply as a model for the proba‐ bility of class membership. You have undoubtedly dealt with logistic regression models many times without even knowing it. They are used widely to estimate quantities like the probability of default on credit, the probability of response to an offer, the probability of fraud on an account, the probability that a document is relevant to a topic, and so on.
Logistic Regression: Some technical Details
-
: to represent the model’s estimate of the probability of class membership of a data item represented by feature vector x (the class + is whatever is the (binary) event that we are modeling)
-
The estimated probability of the event not occurring is therefore
-
Log-odds linear function
= f(x) = → specifies that for a particular data item, described by feature-vector x, the log-odds of the class is equal to our linear function, f(x).
- The logistic function = → estimated probability of class membership
- The model can be applied to the training data to produce estimates that each of the training data points belongs to the target class.
Example: Logistic Regression versus Tree Induction
Though classification trees and linear classifiers both use linear decision boundaries, there are two important differences between them:
- A classification tree uses decision boundaries that are perpendicular to the instance- space axes (see Figure 4-1), whereas the linear classifier can use decision boundaries of any direction or orientation (see Figure 4-3). This is a direct consequence of the fact that classification trees select a single attribute at a time whereas linear classifiers use a weighted combination of all attributes.
- A classification tree is a “piecewise” classifier that segments the instance space re‐ cursively when it has to, using a divide-and-conquer approach. In principle, a clas‐ sification tree can cut up the instance space arbitrarily finely into very small regions (though we will see reasons to avoid that in Chapter 5). A linear classifier places a single decision surface through the entire space. It has great freedom in the orien‐ tation of the surface, but it is limited to a single division into two segments. This is a direct consequence of there being a single (linear) equation that uses all of the variables, and must fit the entire data space.
참고자료
- Data Science for Business by Foster Provost and Tom Fawcett